(TL;DR)
Why do some online casinos continue growing profitably while others struggle despite attracting thousands of new players every month?
The difference often comes down to data. Successful operators don’t simply focus on acquiring players; they monitor the right online casino KPIs to understand player behavior, optimize revenue, improve retention, and identify growth opportunities before they become competitive advantages.
Research consistently shows that improving customer retention by just 5% can increase profitability by 25% to 95%. Yet many casino businesses still prioritize acquisition numbers while overlooking the casino performance metrics that determine long-term sustainability.
Modern operators generate millions of data points every day across registrations, deposits, gameplay, withdrawals, and player engagement. The challenge is knowing which metrics actually matter.
This guide breaks down the most important online casino metrics, how they influence profitability, and why tracking the right KPIs is essential for sustainable growth in today’s competitive iGaming market.
Online casino KPIs (Key Performance Indicators) are measurable values that help operators evaluate business performance across revenue generation, player acquisition, retention, engagement, and operational efficiency.
Unlike standard business metrics, KPIs are tied directly to strategic objectives. They help operators identify trends, measure growth, and make informed decisions based on real player behavior rather than assumptions.
For example, a casino may report increasing revenue while simultaneously experiencing rising player churn. Without KPI tracking, that underlying issue could remain hidden until profitability starts declining.
Likewise, strong registration volumes may appear positive, but if conversion rates and first-time deposits remain low, acquisition efforts may not be delivering meaningful business value.

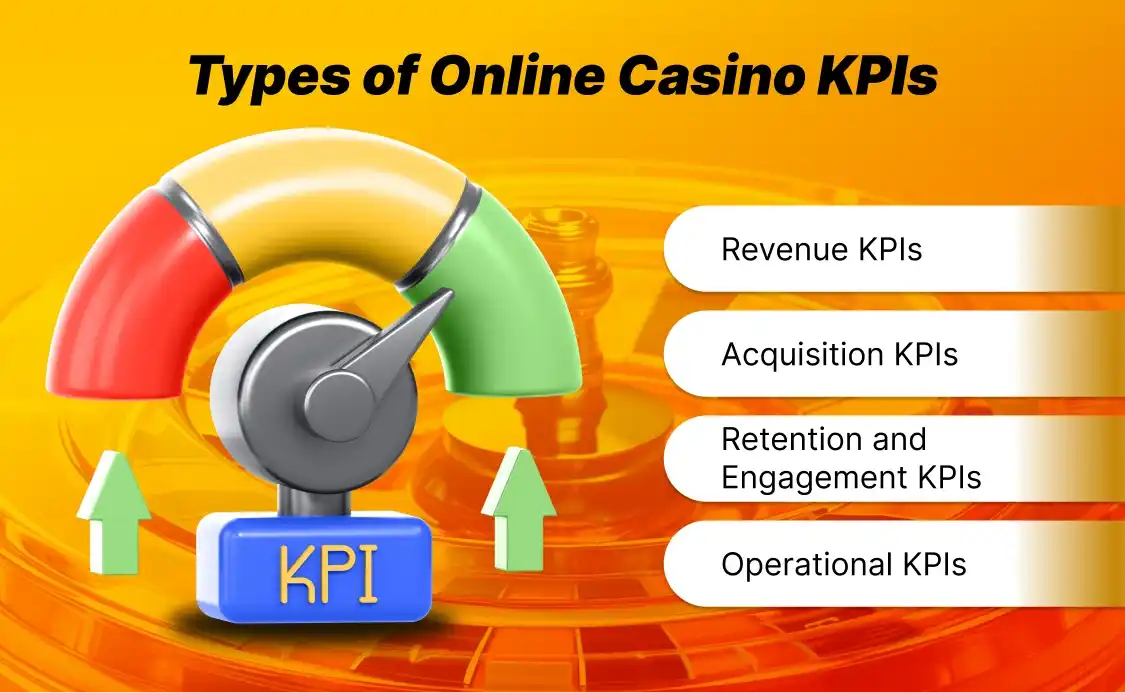
Not all casino KPIs serve the same purpose. Some measure financial performance, while others evaluate growth efficiency, player loyalty, or operational effectiveness.
Understanding these categories makes it easier to build a KPI dashboard that supports sustainable business growth.
Revenue KPIs measure the financial health of a casino business and reveal how effectively player activity translates into earnings.
Common examples include:
Acquisition KPIs evaluate how efficiently operators attract and convert new players.
These metrics typically include:
Retention-focused metrics help operators understand player loyalty and long-term value creation.
Examples include:
Operational metrics measure the efficiency of the systems that support the player experience.
Examples include:
Tracking the right online casino KPIs helps operators understand where revenue is generated, how efficiently players are acquired, and whether growth remains sustainable over time.
While hundreds of casino analytics metrics can be monitored, most successful operators focus on a core set of indicators that directly influence profitability, retention, and business performance.
Revenue metrics provide the clearest picture of overall business health and should form the foundation of every casino KPI dashboard.
i) Gross Gaming Revenue (GGR)
Gross Gaming Revenue (GGR) represents the total amount retained from wagers before operational expenses are deducted.
Formula: Total Bets − Player Winnings
GGR remains one of the most widely tracked casino performance metrics because it provides immediate visibility into gaming activity and revenue generation.
ii) Net Gaming Revenue (NGR)
While GGR measures top-line revenue, NGR shows how much money the operator actually keeps.
Formula: GGR − Bonuses − Taxes − Fees
NGR is often considered one of the most important iGaming KPIs because it reflects true profitability.
iii) Average Revenue Per User (ARPU)
ARPU measures how effectively active players are monetized over a specific period.
Formula: Total Revenue ÷ Active Players
A rising ARPU often indicates stronger player engagement and improved monetization strategies.
iv) Player Lifetime Value (LTV)
Player Lifetime Value estimates the total revenue a player generates throughout their relationship with the casino.
Formula: Average Revenue × Average Customer Lifespan
LTV is one of the most valuable casino growth metrics because it helps operators determine how much they can invest in acquiring and retaining players.
Acquiring players is essential, but sustainable growth depends on acquiring the right players at the right cost. These online casino metrics help operators measure acquisition efficiency and determine whether growth investments are generating long-term value.
i) Cost Per Acquisition (CPA)
Cost Per Acquisition measures the average cost of acquiring a new player.
Formula: Marketing Spend ÷ New Players
CPA helps operators evaluate whether acquisition campaigns are financially sustainable. A low CPA is generally positive, but only if those players continue depositing and engaging with the platform.
ii) First-Time Depositor Rate (FTD Rate)
Not every registration becomes a customer. FTD Rate measures the percentage of registered users who complete their first deposit.
Formula: First-Time Depositors ÷ Total Registrations × 100
A strong FTD Rate often indicates an effective onboarding process, smooth payments, and strong player intent.
iii) Registration-to-Deposit Conversion Rate
This KPI tracks how efficiently players move from registration to becoming active depositing customers.
Low conversion rates may signal friction during verification, payment processing, or account activation.
iv) Cost Per First-Time Depositor
Unlike standard CPA, this metric focuses exclusively on paying customers.
For many operators, Cost Per FTD provides a more accurate picture of acquisition quality because it measures the cost of acquiring actual revenue-generating players.
Businesses looking to scale acquisition efficiently often explore B2B Casino Platform Scaling And Revenue Optimization Strategies to better understand how growth models influence long-term profitability.
While acquisition drives growth, retention drives profitability. Numerous industry studies have shown that retaining existing players is significantly more cost-effective than acquiring new ones.
i) Retention Rate
Retention Rate measures the percentage of players who continue using the platform over a specific period.
Formula: Returning Players ÷ Total Players × 100
Even small improvements in retention can have a substantial impact on revenue and player lifetime value.
ii) Churn Rate
Churn Rate tracks the percentage of players who stop engaging with the platform.
Formula: Lost Players ÷ Total Players × 100
A rising churn rate can indicate player dissatisfaction, poor engagement, or increased competitive pressure.
iii) Monthly Active Players (MAP)
Monthly Active Players measures the number of unique players engaging with the platform each month.
This KPI provides a useful snapshot of platform health and player activity trends.
iv) Session Frequency
Session Frequency measures how often players return to the casino during a specific period.
Players who visit more frequently typically generate greater lifetime value and stronger retention outcomes.
v) Average Session Duration
Average Session Duration tracks how long players remain active during each visit.
Longer sessions often indicate stronger engagement with games, promotions, and platform features.
For operators managing multiple brands, products, or player segments, a Multi Tenant Casino Platform Performance Tracking Framework can provide greater visibility into engagement trends across the entire business.
Operational performance has a direct impact on player satisfaction, retention, and revenue generation. Even the strongest acquisition strategy can be undermined by inefficient payments or poor user experiences.
i) Deposit Success Rate
Deposit Success Rate measures the percentage of deposit attempts that are completed successfully.
Formula: Successful Deposits ÷ Deposit Attempts × 100
Payment friction remains one of the most common causes of player abandonment, making this one of the most important casino performance metrics.
ii) Withdrawal Processing Time
Withdrawal Processing Time measures how quickly player payouts are completed.
Fast withdrawals build trust, improve player satisfaction, and contribute to stronger retention rates. In today’s competitive iGaming environment, payout speed is often a key differentiator between operators.
Tracking individual metrics is useful, but sustainable growth comes from understanding the bigger picture. A casino can report strong acquisition numbers while profitability declines, or generate record revenue while retention steadily falls.
The most successful operators use KPI tracking to identify relationships between acquisition, engagement, retention, and profitability. This allows them to spot performance issues early and make informed decisions before revenue is affected.
As casino operations scale, centralized reporting becomes increasingly important. Businesses planning long-term growth should ensure they Build An Online Casino Platform With Scalable Infrastructure capable of supporting accurate analytics, reporting, and performance monitoring across every stage of the player journey.
Tracking individual casino KPIs is useful, but analyzing them in isolation can lead to misleading conclusions. A casino may report strong player acquisition numbers while profitability declines, or generate record revenue while retention continues to fall.
The most successful operators focus on the relationship between KPIs rather than individual metrics. Each metric influences another, creating a growth chain that ultimately determines long-term profitability.
| Growth Stage | Key KPI | What It Reveals |
| Acquisition | CPA | Cost of acquiring new players |
| Conversion | FTD Rate | Quality of acquired traffic |
| Engagement | Session Frequency | Player activity levels |
| Retention | Retention Rate | Player loyalty |
| Revenue | LTV | Long-term player value |
| Profitability | NGR | Actual business earnings |
For example, reducing CPA may appear positive on paper. However, if lower acquisition costs result in lower-quality players, First-Time Depositor Rates and retention can decline, ultimately reducing Player Lifetime Value.
Likewise, a casino can generate strong GGR, but excessive bonuses or operational expenses may reduce NGR, creating profitability challenges despite apparent growth.
The key is to view online casino KPIs as a connected ecosystem. Improvements in retention often increase LTV, allowing operators to invest more confidently in acquisition while maintaining profitability.
Tracking dozens of online casino KPIs can quickly become overwhelming. A well-structured dashboard helps operators focus on the metrics that directly impact growth and profitability.
Start by identifying what you want to improve, whether it’s revenue, retention, acquisition efficiency, or player value.
| KPI Group | Key Metrics |
| Revenue | GGR, NGR, ARPU, LTV |
| Acquisition | CPA, FTD Rate, Conversion Rate |
| Retention | Retention Rate, Churn Rate |
| Operations | Deposit Success Rate, Withdrawal Time |
Keep leadership reporting simple by prioritizing:
Many operators use an Advanced Casino Management System For KPI Monitoring to centralize data and gain real-time visibility into performance.
For long-term scalability, it’s also worth reviewing an Online Casino Software Development Guide For Platform Growth to ensure reporting capabilities can grow alongside the business.
Even with the right online casino KPIs in place, poor interpretation can lead to bad decisions. Here are some of the most common mistakes operators make.
Large registration numbers may look impressive, but they provide little value if deposits, retention, and revenue remain weak.
Strong GGR doesn’t always mean strong profitability. Operators should monitor NGR alongside revenue metrics to understand actual business performance.
Acquiring new players is important, but retaining existing players often delivers greater long-term value. Retention and churn should be monitored consistently.
Metrics work together. A high CPA may be acceptable if player LTV remains significantly higher.
KPI reviews should follow a consistent schedule. Regular reporting helps identify trends early and supports better decision-making.
Tracking online casino KPIs is only valuable when those insights lead to action. From revenue monitoring and player retention analysis to operational reporting, having the right technology stack is essential for sustainable growth.
TIGCasino helps operators make data-driven decisions through scalable platforms, analytics tools, and performance reporting. Businesses focused on player retention can benefit from a Casino PAM Solution For Player Analytics And Retention, while operators seeking faster deployment can explore a Turnkey Casino Solution With Built In Business Intelligence that combines platform infrastructure with built-in reporting capabilities.
Online casino KPIs provide the foundation for sustainable growth in an increasingly competitive iGaming market. While revenue metrics such as GGR and NGR remain important, long-term success depends equally on player acquisition efficiency, retention, engagement, and operational performance.
The most successful operators do not focus on individual numbers. Instead, they analyze how key metrics work together to improve player value, profitability, and overall business performance. By building a structured KPI framework and consistently reviewing performance, operators can make smarter decisions and create a stronger foundation for growth.
Online casino KPIs are measurable performance indicators used to track revenue, player acquisition, retention, engagement, and operational efficiency.
There is no single KPI that guarantees success. However, Player Lifetime Value (LTV), Net Gaming Revenue (NGR), and Retention Rate are among the most important metrics for long-term profitability.
Gross Gaming Revenue (GGR) measures total wagers minus player winnings, while Net Gaming Revenue (NGR) reflects actual earnings after bonuses, taxes, commissions, and other deductions.
Retention benchmarks vary by market and player segment. Rather than targeting a specific number, operators should focus on improving retention consistently while reducing churn.
Player Lifetime Value helps operators understand the long-term revenue potential of each player, making it easier to optimize acquisition spending and retention strategies.
Core KPIs should be reviewed weekly, while broader growth trends and strategic performance metrics should be analyzed monthly and quarterly.

Baivee Banerjee

Request a Demo